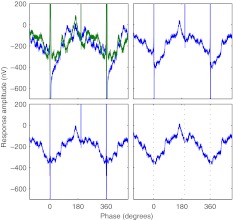
FIG. 2.
Example of stimulus artifacts removal. Response amplitude as a function of time for subject S6, active stimulation electrode 9, BP + 4, low-rate pulse train at C level, modulation frequency 44 Hz, recording electrode P3, averaged period plotted two times for clarity; artifacts of stimulus and power-up pulses can be seen at 0°, 198°, and 360°. Top left: raw recorded responses to cathodic-first (blue) and anodic-first (green) stimulus polarities. Top right: average of both stimulus polarities. Bottom left: inversely filtered average. Bottom right: filtered average with stimulus interpolation; dotted lines: positions of stimulus and power-up pulses.

