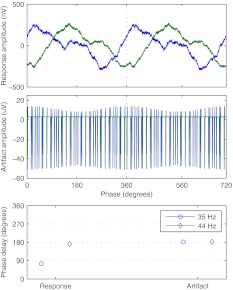
FIG. 4.
Example of neural response and stimulus artifacts for different modulation frequencies. Subject S2, active stimulation electrode 13, BP + 4, recording electrode TP9, PWM high-rate pulse train at C level; top: time-domain signal of the neural response; middle: time-domain signal of the stimulus artifacts; bottom: phase delay for both neural response and stimulus artifacts.

