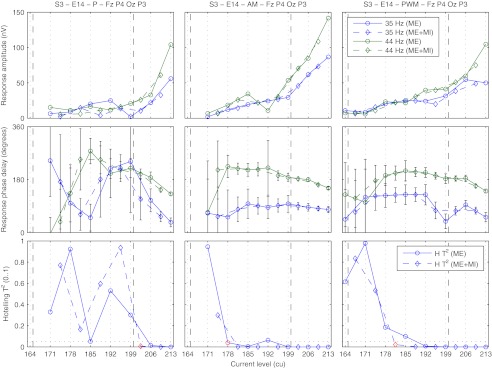
FIG. 5.
Example for the determination of electrophysiological thresholds from response growth functions. Subject S3, active stimulation electrode 14, BP + 4, recording electrodes FZ, P4, OZ, and P3; left, middle, right column: low-rate (P), AM, and PWM high-rate pulse trains, respectively; top, middle, bottom row: response amplitude, phase delay, and results of the Hotelling T2 test for the combination of multiple recording electrodes (ME, solid lines) and multiple recording electrodes and stimulus intensities (ME + MI, dashed lines); dashed vertical lines: behavioral T levels for 900 and 40 pps; error bars: possible change in phase delay that could be introduced by the noise in the response bin based on the standard error of the response bin across epochs and recording electrodes corrected for channel covariance; dotted horizontal lines: significance level of p < 0.05; red markers: determined electrophysiological thresholds.

