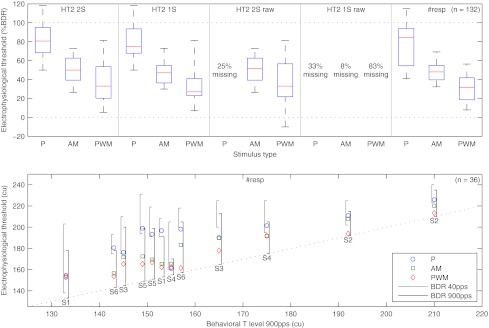
FIG. 9.
Electrophysiological thresholds derived from response growth functions and number of significant responses. Top: box plot of electrophysiological thresholds across subjects for the five different analysis methods relative to the behavioral dynamic range at 900 pps (n = 132); HT2 2S and HT2 1S: thresholds derived from the response growth functions with a two-sample and one-sample Hotelling T2 test, respectively; #resp: thresholds derived from the sigmoid functions fit to the number of significant responses; raw: thresholds derived from recordings without stimulus artifact removal; percentage missing: some electrophysiological threshold could not be determined. Bottom: individual electrophysiological thresholds derived from the sigmoid functions fit to the number of significant responses versus behavioral T levels at 900 pps (n = 36); left and right brackets: behavioral dynamic range at 40 and 900 pps, respectively; overlapping cases have been slightly shifted for clarity.

