FIG. 6.
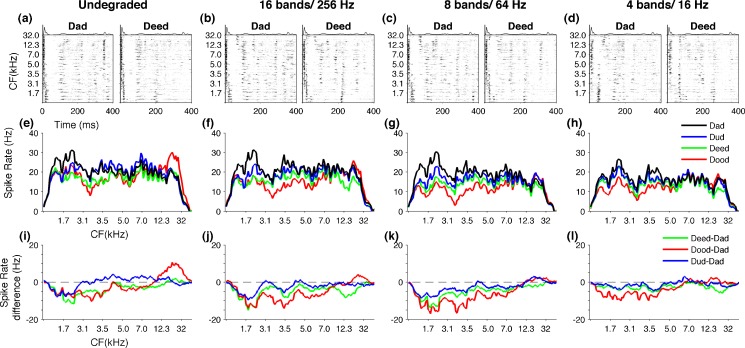
Neural responses to vowels neurograms depicting the evoked activity over the first 400 ms for /dad/ and /deed/ of undegraded stimuli (A), 16 bands and 256 Hz (B), eight bands and 64 Hz (C), and four bands and 16 Hz (D). The spike sound profiles (spatial patterns), plotting the number of spikes fired for the 400 ms duration by A1 neurons arranged according to their characteristic frequency. Each syllable with a different vowel (/dad/, /dud/, /deed/, /dood/) generates a unique spatial pattern in A1 at undegraded condition (E). The spatial patterns remain distinct when stimuli are noise vocoded with 16 bands and 256 Hz (F) or eight bands and 64 Hz. The patterns become less distinct with more severe degradations like four bands and 16 Hz. The neural differences generated in A1 are plotted by subtracting the spatial pattern of /dad/ from /dud/, /deed/, and /dood/ at undegraded condition (I).The zero line indicates /dad/ minus /dad/. The neural differences between spatial patterns remain clearly visible when sounds are noise vocoded with 16 bands and 256 Hz (E) or eight bands and 64 Hz (F). With more severe degrees of spectral and temporal degradation neural differences become closer to zero line indicating reduced neural dissimilarity, as shown for four bands and 16 Hz (G).

