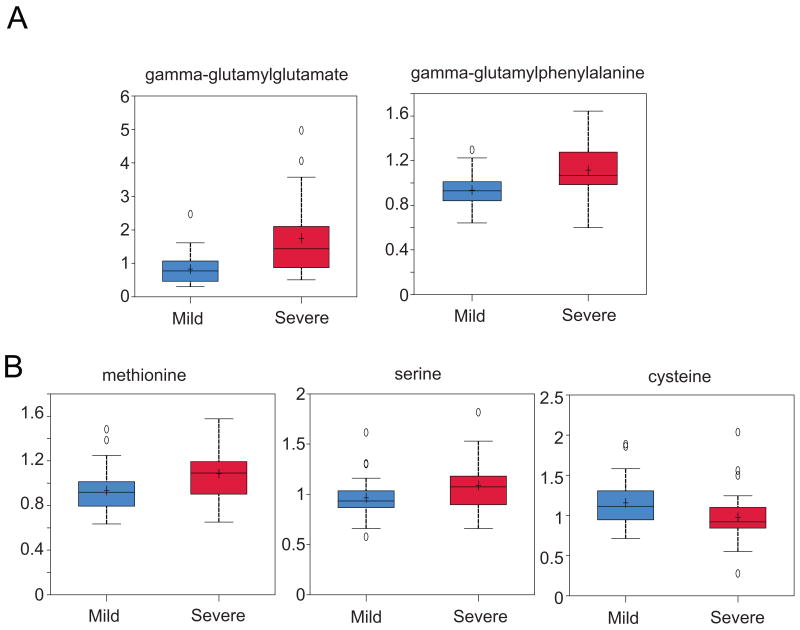
Figure 4. Box and Whiskers plots of differentially regulated serum metabolites associated with oxidative stress.
A selection of time-matched samples for binary comparison of mild (30 with stage 0-1 fibrosis) versus severe (30 with stage 3-4 fibrosis) liver disease were analyzed. A) Representative examples of gamma-glutamyl peptides that were significantly increased (P < 0.05) in HCV infected liver transplant patients who develop significant liver injury. B) Metabolites involved in cysteine biosynthesis that were significantly different between the mild and severe disease groups. Median scaled values are presented on the y-axis.

