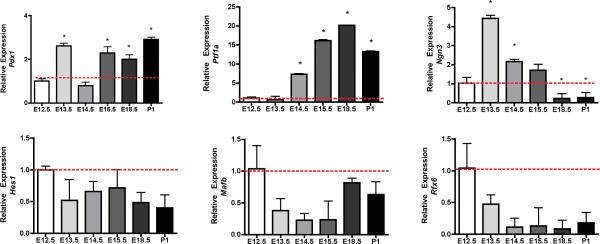
FIGURE 1.
Temporal expression of Pdx1, Ptf1a, Neurog3, Hes1, Sox9 and Rfx6 mRNA by quantitative PCR. Q-RTPCR was performed on cDNA synthesized from fetal pancreas and adult CD1 islets using a 5' nuclease assay and FAM ® dye labeled Taqman MGB probes with two PCR primers. Endogenous gapdh was used for normalization. Data (mean ± SE) is expressed relative to a control sample (E12.5). For statistical analysis one-way analysis of variance (ANOVA), probability value (p < 0.05) was considered significant, followed by Student's T- test (p<0.05).

