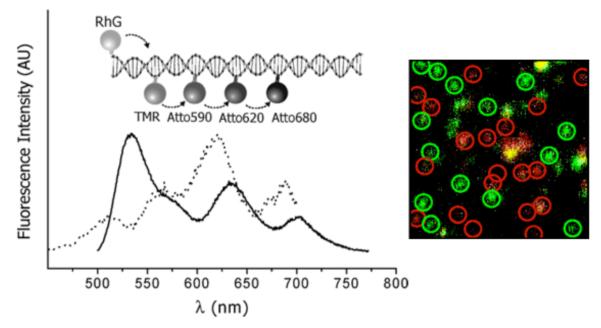
Figure 18.
(Left) DNA photonic wire containing five different fluorophores, held in position through hybridization of the fluorophore-labeled oligonucleotides to a longer complementary strand, and its bulk excitation spectrum (λcoll = 703 nm; dotted line) and fluorescence spectrum (λex = 468 nm; solid line). (Right) Single molecule fluorescence image of the DNA photonic wire spin-coated onto a glass surface acquired using confocal scanning optical microscopy. Adapted with permission from ref 230. Copyright 2006 American Chemical Society.

