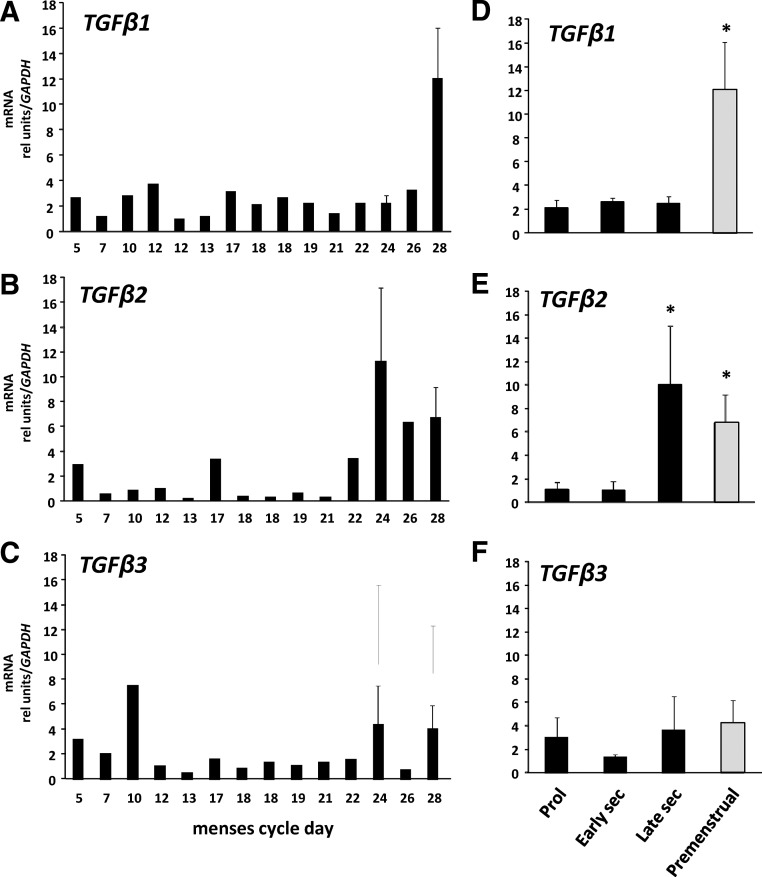
Fig. 2.
Regulation of TGF family members in human endometrium. Levels of TGFβ1 (A), TGFβ2 (B), and TGFβ3 (C) mRNA were quantified using quantitative PCR and expressed relative to that of GAPDH as a function of menstrual cycle day. Error bars indicate three to four tissues per day. Data in D–F represent mean ± sem of tissues obtained in proliferative (Prol) (n = 6), early secretory (sec) (n = 5), late secretory (n = 5), and premenstrual (n = 4) phase. *, P < 0.05 compared with proliferative or early secretory, ANOVA.

