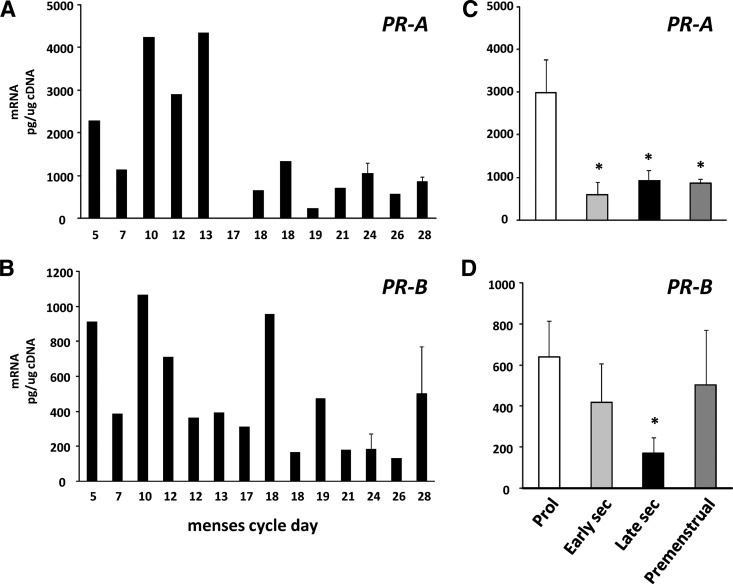
Fig. 7.
Regulation of PR isoforms in human endometrial tissues. Levels of PR-A (A) and PR-B (B) were quantified using quantitative PCR and standard curves of PR cDNA. Levels of PR-B were subtracted from total PR to approximate levels of PR-A relative to that of GAPDH as a function of menstrual cycle day. Error bars indicate three to four tissues per day. Data in C and D represent mean ± sem of tissues obtained in proliferative (Prol) (n = 6), early secretory (sec) (n = 5), late secretory (n = 5), and premenstrual (n = 4) phase. *, P < 0.05 compared with proliferative.

