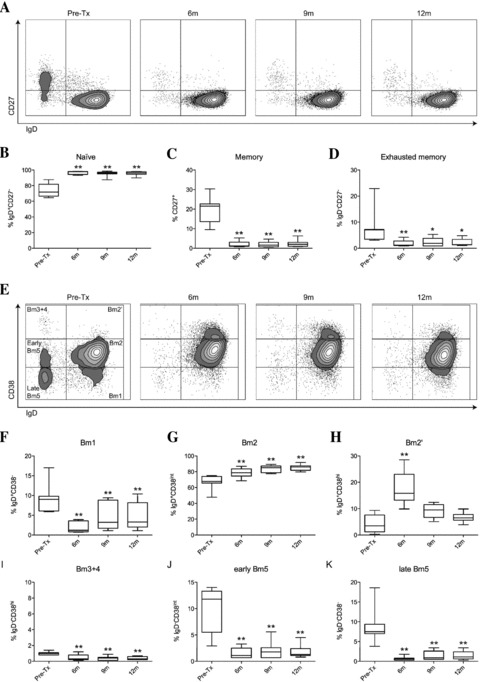
Figure 2. Phenotype of repopulating B cells after alemtuzumab induction therapy up to 12 months after transplantation.

(A) Representative dot plots of repopulating B cells using the CD27-IgD classification. (B) Percentage of naïve B cells (IgD+CD27−) within CD19 gate, (C) percentage of memory B cells (both IgD−CD27+ and IgD+CD27+) within CD19 gate and (D) percentage of exhausted memory B cells (IgD−CD27−) within CD19 gate (n = 7). (E) Representative dot plots of repopulating B cells using the Bm1-Bm5 classification. (F) Percentage of Bm1 cells (IgD+CD38−) within CD19 gate, (G) percentage of Bm2 cells (IgD+CD38int) within CD19 gate, and (H) percentage of Bm2’ cells (IgD+CD38hi) within CD19 gate, (I) percentage of Bm3 + 4 cells (IgD−CD38hi) within CD19 gate, (J) percentage of early Bm5 cells (IgD−CD38int) within CD19 gate and (K) percentage of late Bm5 (IgD−CD38−) within CD19 gate (n = 7). All statistics: repeated measures ANOVA with posttesting by Dunnett Multiple Comparisons Test, *p < 0.05, **p < 0.01.
