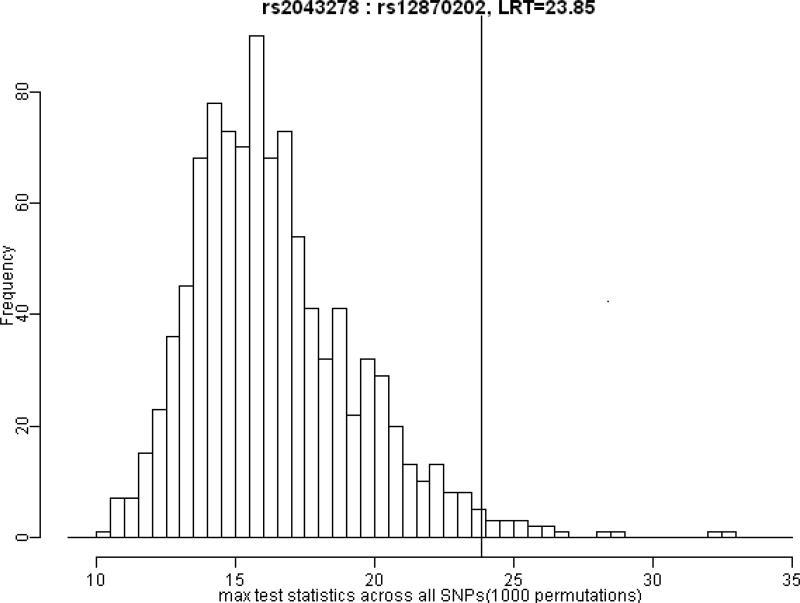
Figure 2.
Distribution of maximum LRT values over 1000 replicates. Histograms represent the frequency of maximum test statistics generated under the null hypothesis of no GxG interaction. The vertical line shows the position of observed test statistic of GxG interaction between rs12870202 and rs2043278. About 1.9% of permutated test statistics exceeded this observed value, giving an empiric p-value corrected for multiple testing (p=0.019).

