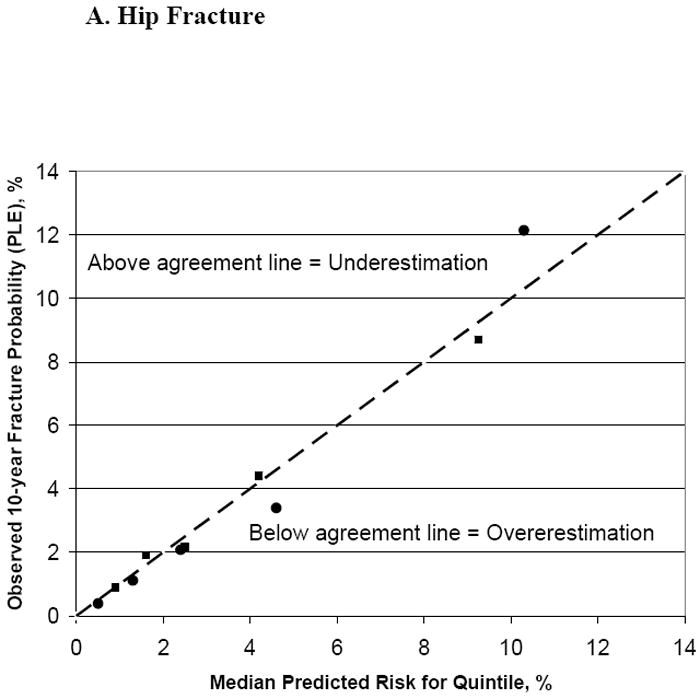
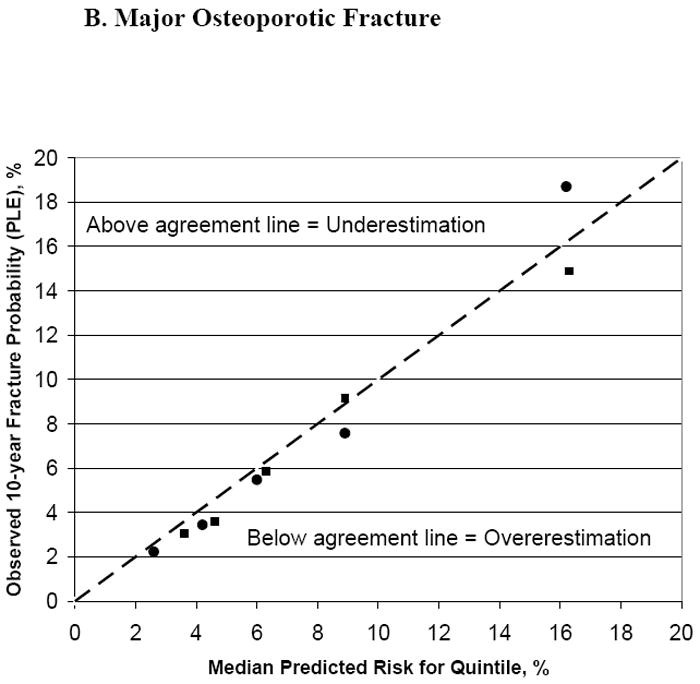
Figure 2. Observed Versus Predicted Fracture Probability (%), With and Without BMD, by Quintiles of Fracture Risk.


Squares represent the predicted fracture probability without BMD used in the risk calculator, circles with BMD used in the calculator.
| Hip fracture: | Major osteoporotic fracture: |
| Without BMD: Quintile 1: <1.3% | Without BMD: Quintile 1: <4.1% |
| Quintile 2: 1.3 to <2.0% | Quintile 2: 4.1 to <5.6% |
| Quintile 3: 2.0 to <3.2% | Quintile 3: 5.6 to <7.1% |
| Quintile 4: 3.2 to <6.0% | Quintile 4: 7.1 to <11.3% |
| Quintile 5: ≥6.0% | Quintile 5: ≥11.3% |
| With BMD: Quintile 1: <0.9% | With BMD: Quintile 1: <3.5% |
| Quintile 2: 0.9 to <1.8% | Quintile 2: 3.5 to <5.1% |
| Quintile 3: 1.8 to <3.3% | Quintile 3: 5.1 to <7.3% |
| Quintile 4: 3.3 to <6.7% | Quintile 4: 7.3 to <11.3% |
| Quintile 5: ≥6.7% | Quintile 5: ≥11.3% |
