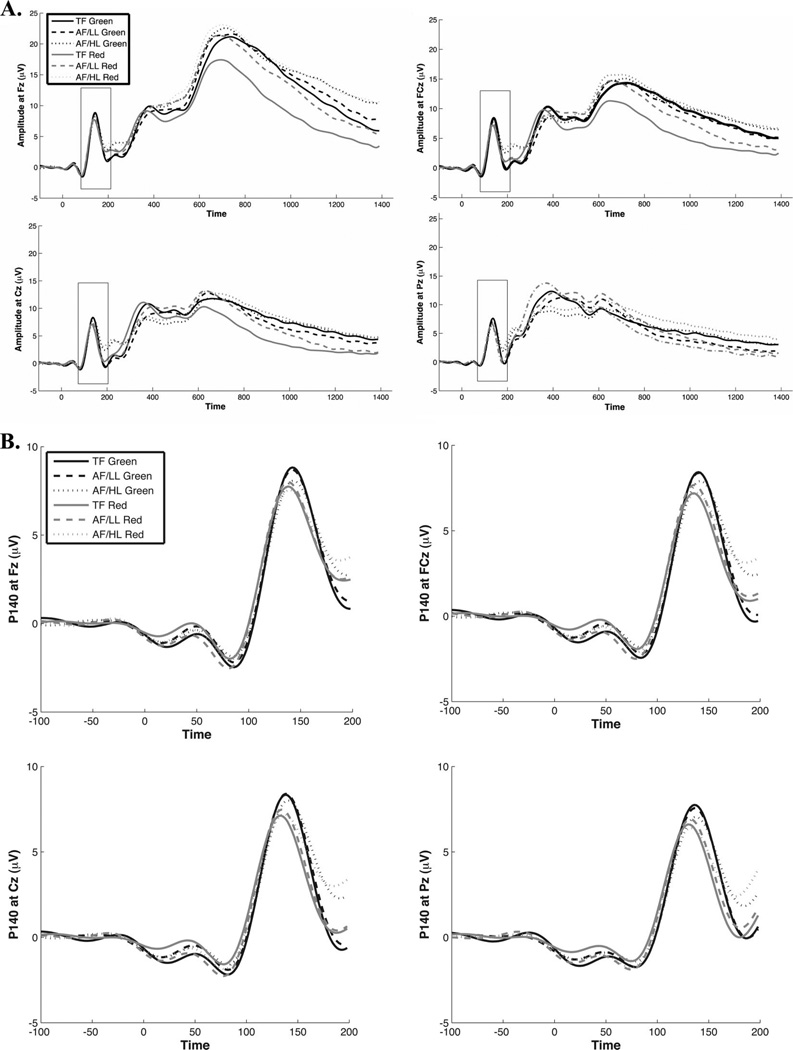
Figure 1.
ERP waveform across midline sites (Fz, FCz, Cz, and Pz). A: Stimulus-locked average ERP waveforms in the three task conditions for all participants at midline electrode sites. A digital low-pass filter was applied offline before plotting the waveforms shown here. Box represents peak identified as P140. B: Isolated P140 waveform in all three task conditions for all participants at midline electrode sites.

