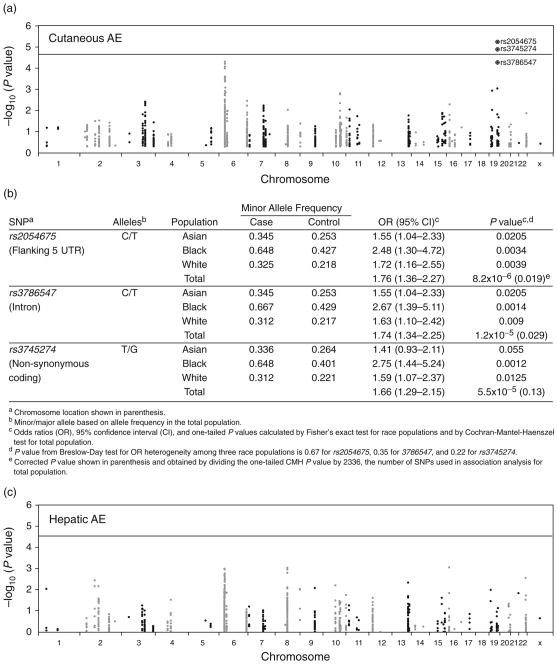
Fig. 2.
Associations between single-nucleotide polymorphisms and adverse events. Panel (a) is a Manhattan plot of the results for cutaneous adverse events (AEs) compared with controls. Panel (b) shows CYP2B6 SNPs associated with cutaneous AEs. Panel (c) is a Manhattan plot of the results for hepatic AEs compared with controls. In panels (a) and (b), the −log10 P values were plotted against chromosome positions. Lines indicate a Bonferroni corrected P value of 0.05. Panel (a) represents 2336 SNPs. Panel (c) represents 2058 SNPs. The three SNPs labeled are in CYP2B6.

