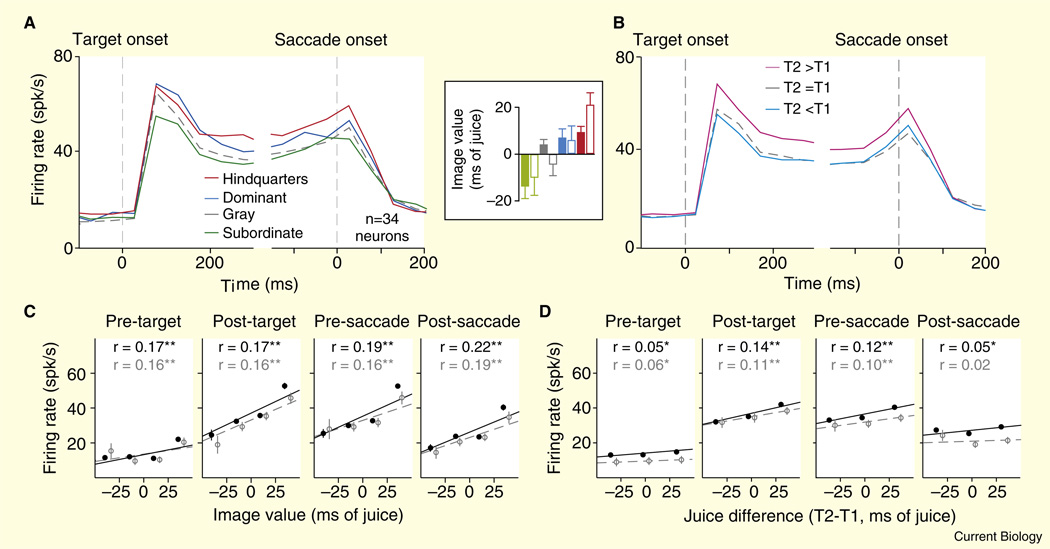
Figure 2. The LIP population response simultaneously encodes social image value and fluid value during a ‘pay-per-view’ choice task.
(A) Average firing rate for 34 neurons plotted against time for all trials in which the subject chose to view the image (T2) in the neuron’s response field, separated by image class. Inset: values determined for different image classes for two male monkey subjects (open and closed bars), in ms of fluid delivery time. Positive deflections indicate the subject was willing to forgo fluid to view that image class. Negative deflections indicate the subject required fluid overpayment to choose that image class. Hindquarters refers to the perineal sexual signals of familiar females. Dominant and subordinate refer to the faces of familiar dominant and subordinate males. Gray refers to a plain gray square matched for size and luminance to the other image classes. (B) Average firing rate of the population for all trials in which the subject chose to view the image (T2) in the neuron’s response field, separated by fluid value relative to the non-chosen target (T1). (C) Firing rates plotted as a function of image value in four 200 ms epochs. Black symbols represent regressions performed on all data in which the subject chose to view the image, and gray symbols represent the same analysis restricted to trials in which the fluid payoff for choosing T1 was equal toT2. (D) Firing rates plotted as a function of the difference in fluid payoff between T2 and T1. Black symbols represent regression performed on all data in which the subject chose to view the image, and gray symbols represent the same analysis restricted to trials in which the image value calculated for that block was greater than -5 and less than 5 ms. Error bars represent SEM. The data in (C,D) were binned for display, but all regressions were performed on raw data. *p < 0.05, **p < 10 −3. (Adapted with permission from [19].)

