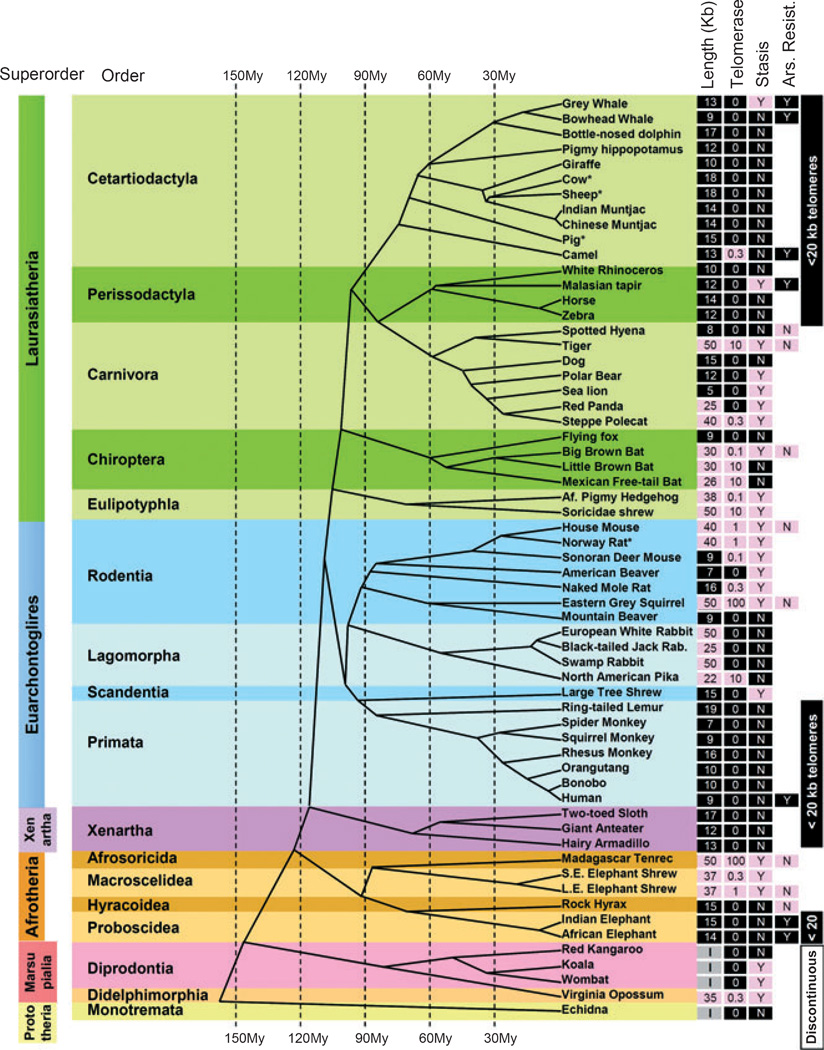
Fig. 1.
Evolutionary distribution of telomere length, telomerase activity and stasis (stress or aberrant signaling induced senescence) in the mammalian evolutionary tree. Telomere length, telomerase activity, and stasis induction run in evolutionary clades. Telomere length was measured by terminal restriction fragment (TRF) analysis: Values < 20 kb are shaded black, while values > 20 kb are shaded pink. Nonplacental mammalian orders such as Marsupials and Monotremes show the presence of restriction enzyme recognition sites intercalated between the telomeric (TTAGGG)n sequences and thus are labeled as being of indeterminate size (I). Telomerase activity was detected with TRAP: Values are expressed as a%of the activity in the reference lung adenocarcinoma tumor line H1299, and shaded black if absent and pink if any activity was detected. Stasis: (N) with black shading = cells grew beyond 15 doublings, (Y) with pink shading = cells growth arrested in culture before population doubling 15. Based on these characteristics, some taxonomic orders could be described as exhibiting uniformly human-like telomere phenotypes or having discontinuous telomeres. Arsenite resistance: (Y) with black shading = LD90 > 20 mm sodium arsenite after 4 h exposure, (N) with pink shading = LD90 < 5 mm (see Fig. 5). Published data on Primates (Steinert et al., 2002), Lagomorphs (Forsyth et al., 2005), and Muntjacs (Zou et al., 2002) are from our laboratory, and thus are directly comparable. Data from other laboratories are indicated by (*) [cow (Lanza et al., 2000), sheep (Cui et al., 2002), pig (Fradiani et al., 2004; Oh et al., 2007), rat (Mathon et al., 2001)]. Scientific names and specific data for each species (scientific name, growth curves, TRF gels, telomerase assays, mass, lifespan) are provided in Table S1 and Fig. S1 (Supporting Information). The telomere lengths for giraffe, rhinoceros, and anteater are adjusted for a large digestion-resistant subtelomeric region using the rate of disappearance of the telomeric signal with increased cell doublings (see Fig. S1, Supporting Information). Cladogram adapted from Bininda-Emonds et al. (2007, 2008).

