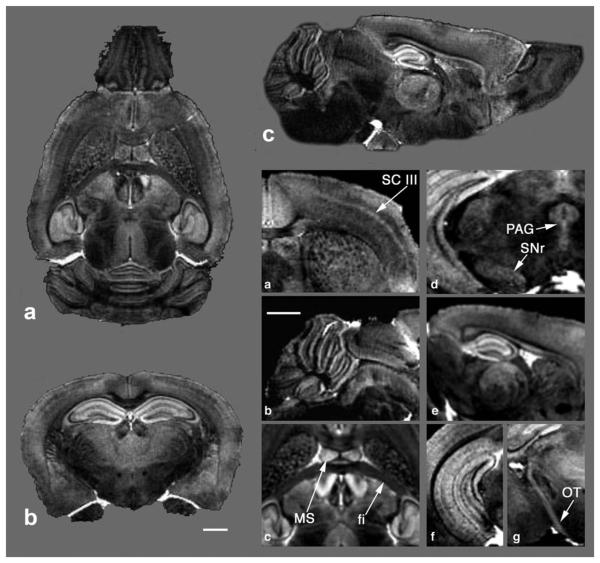
FIG. 4.
Images from a 3D FLASH dataset of a mouse brain treated with the modified method. a-c: Selected coronal, axial, and sagittal slices. a-g: Magnified views of the MR microscopy data showing that different locations in the brain reveal a wealth of anatomic details, such as the basal ganglia, cortex layers, and neural tracts. SC III, somatosensory cortex layer III; PAG, periaqueductal gray; SNr, substantial nigra; OT, optic track; MS, medial septal nucleus; fi, fimbria. Scale bar = 1mm.

