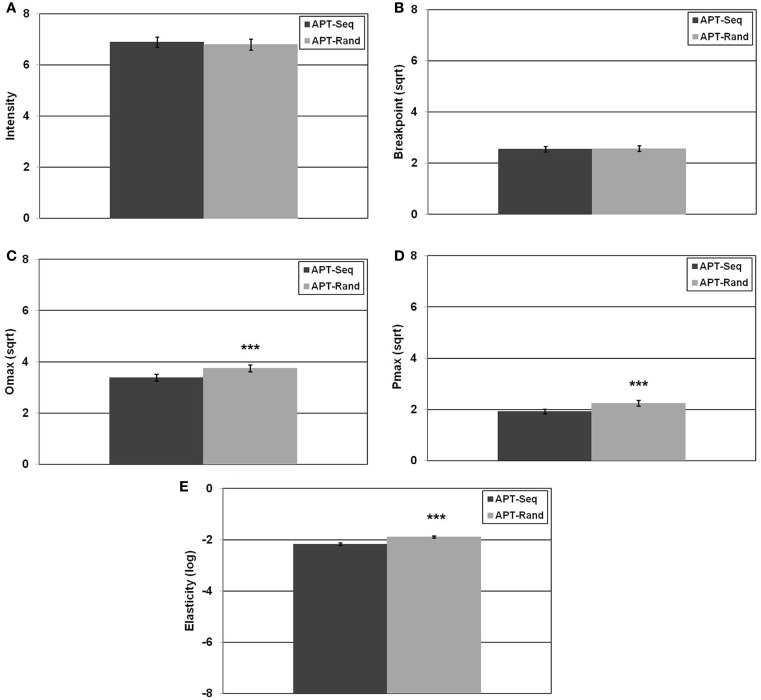
Figure 2.
Indices of alcohol demand across sequential (APT-Seq; dark gray bars) and randomized (APT-Rand; light gray bars) versions. (A) Depicts intensity of demand. (B) Depicts square-root transformed breakpoint. (C) Depicts square-root transformed Omax. (D) Depicts square-root transformed Pmax. (E) Depicts logarithmically transformed elasticity (α). Individual bars represent mean (± standard error). Note, N = 91; ***p < 0.001.

