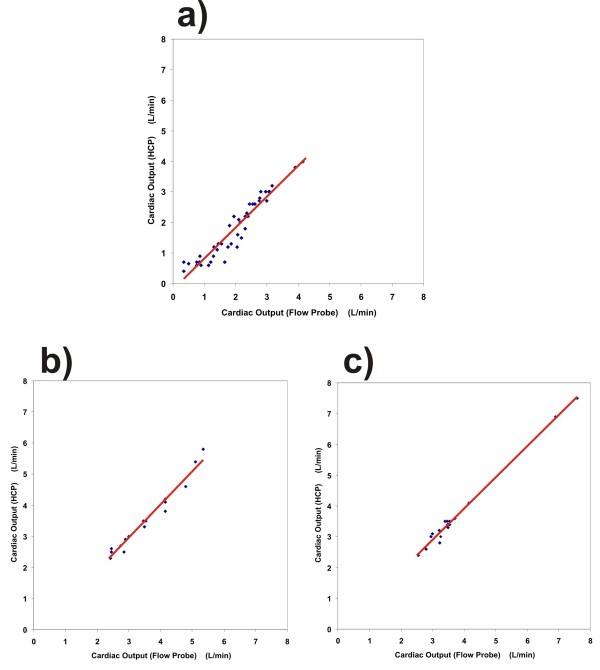
Figure 3.
Regression plots for three methods of manipulating the cardiac output. a) Flow restriction in the vena cava inferior: r = 0.955, slope = 1.02, and 95% CI is 0.92 to 1.12. b) Cardiac pacing: r = 0.982, slope = 1.06, and 95% CI is 0.95 to 1.17. c) Dobutamine administration: r = 0.981, slope = 1.01, and 95% CI is 0.95 to 1.07. For each of the three plots, a regression line (red solid line) has been added.

