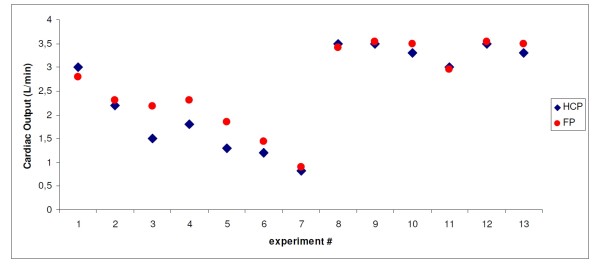
Figure 4.
Example of a series of data points from one single animal. In this graph, the results of the experiments on animal #3 are rendered, showing the cardiac output as measured by the HCP (CO-HCP, dark blue diamonds), and as measured by the ultrasonic flow probe (CO-FP, red dots). The enumeration of the experiments along the x-axis corresponds to the chronological order in which the measurements have taken place on this animal. Thirteen independent data points have been collected. Data points #1 to #7 represent increasing levels of vena cava constriction; data points #8 to #10 represent three levels of external cardiac pacing (at 100 bpm, 120 bpm, and 140 bpm, respectively), and data points #11 to #13 represent the effects of one minute, four minutes, and seven minutes of continuous dobutamine administration, respectively.

