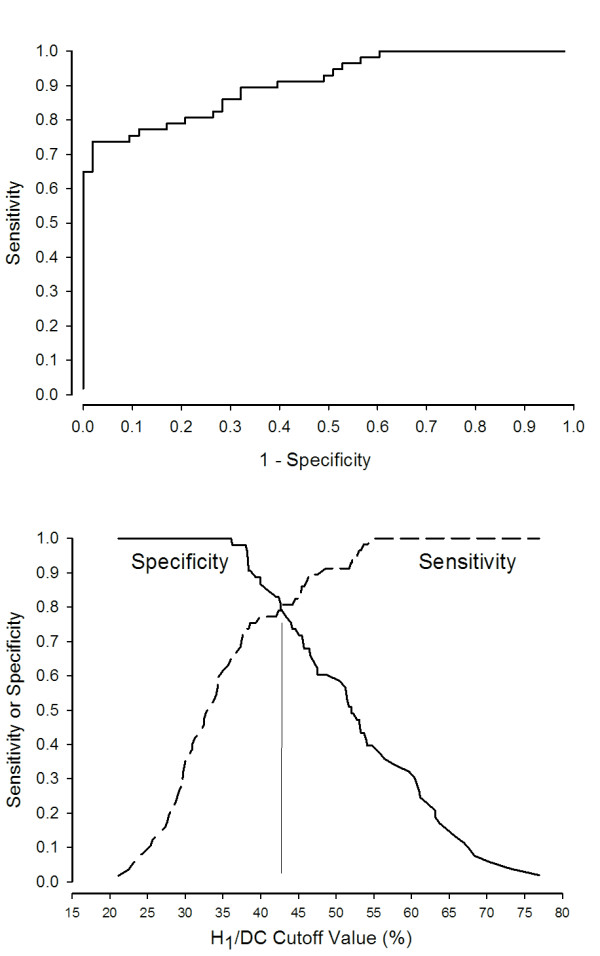
Figure 5.

Receiver Operating Characteristic (ROC) and sensitivity analysis. (Top) ROC curve for H1/DC. Area under the curve is 0.91 ± 0.03 (P < 0.0001). (Bottom) Sensitivity and specificity plotted as functions of H1/DC values. The curves intersect at H1/DC = 42.9%, a value that identifies asynchrony (as defined by AI > 10%) with sensitivity and specificity of 82.7% each. DC, zero frequency amplitude; H1, first harmonic peak amplitude.
