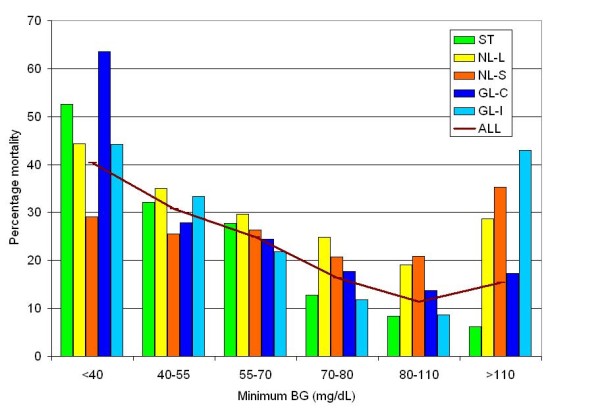
Figure 1.

Relationship between minimum BG during ICU stay and mortality, stratified by subpopulation. BG, blood glucose; GL-C, GLUCONTROL-control arm; GL-I, GLUCONTROL-intensive arm; NL-L, Netherlands-"loose"; NL-S, Netherlands-"strict"; ST, Stamford.
