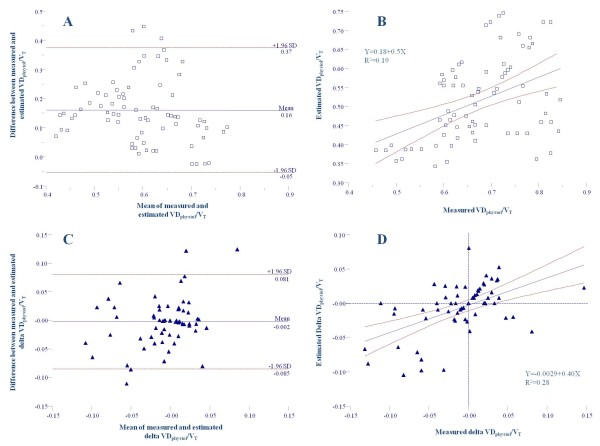
Figure 4.
Comparison between measured VDphysiol/VT and estimated VDphysiol/VT [14]using a Bland and Altman representation (left) and a linear correlation (right). (A) and (B) Comparison for each paired data set (n = 78) in the supine position and after 3, 6, 9, 12 and 15 hours in the prone position. (C) and (D) Comparison of changes in VDphysiol/VT assessed according to the two methods between each time of measurement and the previous one. VDphysiol/VT: ratio of physiological dead space to tidal volume.

