Figure 1.

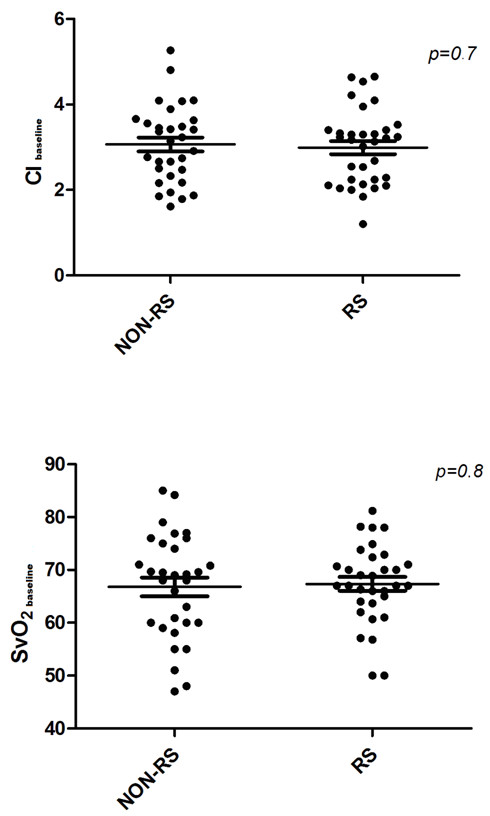
Scatterplots of baseline CI (top) and SvO2 (bottom) values in responders (RS) and nonresponders (NON-RS). CI: confidence interval; SvO2: mixed venous oxygen saturation. Thin lines represent mean values, and thick lines the standard errors.

Scatterplots of baseline CI (top) and SvO2 (bottom) values in responders (RS) and nonresponders (NON-RS). CI: confidence interval; SvO2: mixed venous oxygen saturation. Thin lines represent mean values, and thick lines the standard errors.