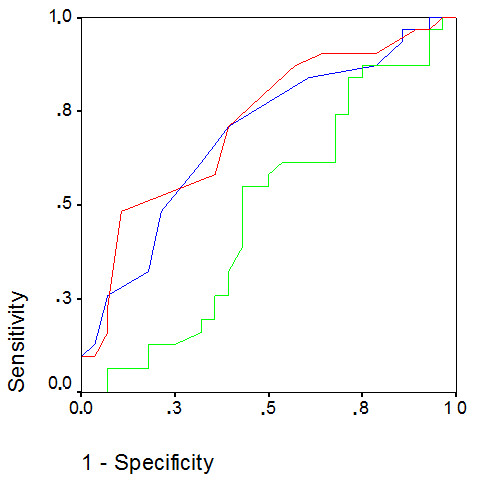
Figure 3.

ROC curves for baseline values of SvO2 (green line), CVP (blue line) and PAOP (red line). Diagonal segments are produced by ties. AUC were 0.51, 0.68 and 0.71 for SvO2, CVP and PAOP, respectively. CVP at a cutoff of 11 mmHg had a sensitivity of 67% and a specificity of 54% for predicting fluid responsiveness. PAOP at a cutoff of 13 mmHg had a sensitivity of 59% and a specificity of 65%. AUC: area under the curve; CVP: central venous pressure; PAOP: pulmonary artery occlusion pressure; ROC: receiver operating characteristic; SvO2: mixed venous oxygen saturation.
