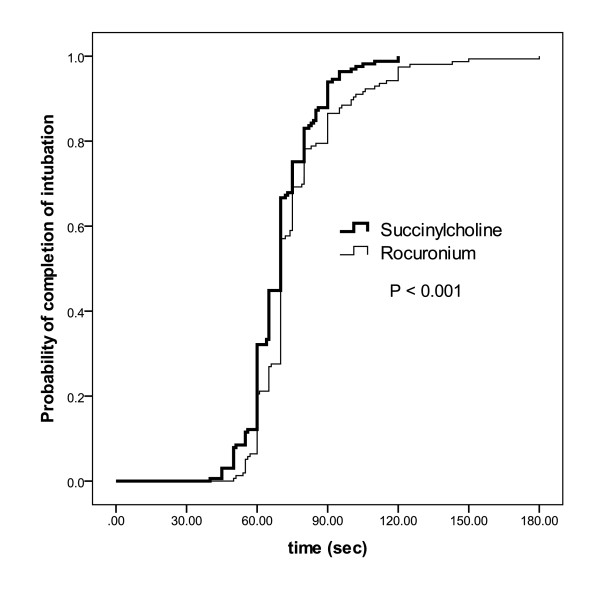
Figure 2.
Intubating times. Kaplan-Meyer curve of the probability of the completion of the endotracheal intubation sequence including succinylcholine or rocuronium in patients successfully intubated in the first attempt. The x-axis denotes the time interval after the beginning of the injection of the induction drug. The intubation sequence was defined to be completed upon the first appearance of end-tidal carbon dioxide after intubation.

