Figure 6.
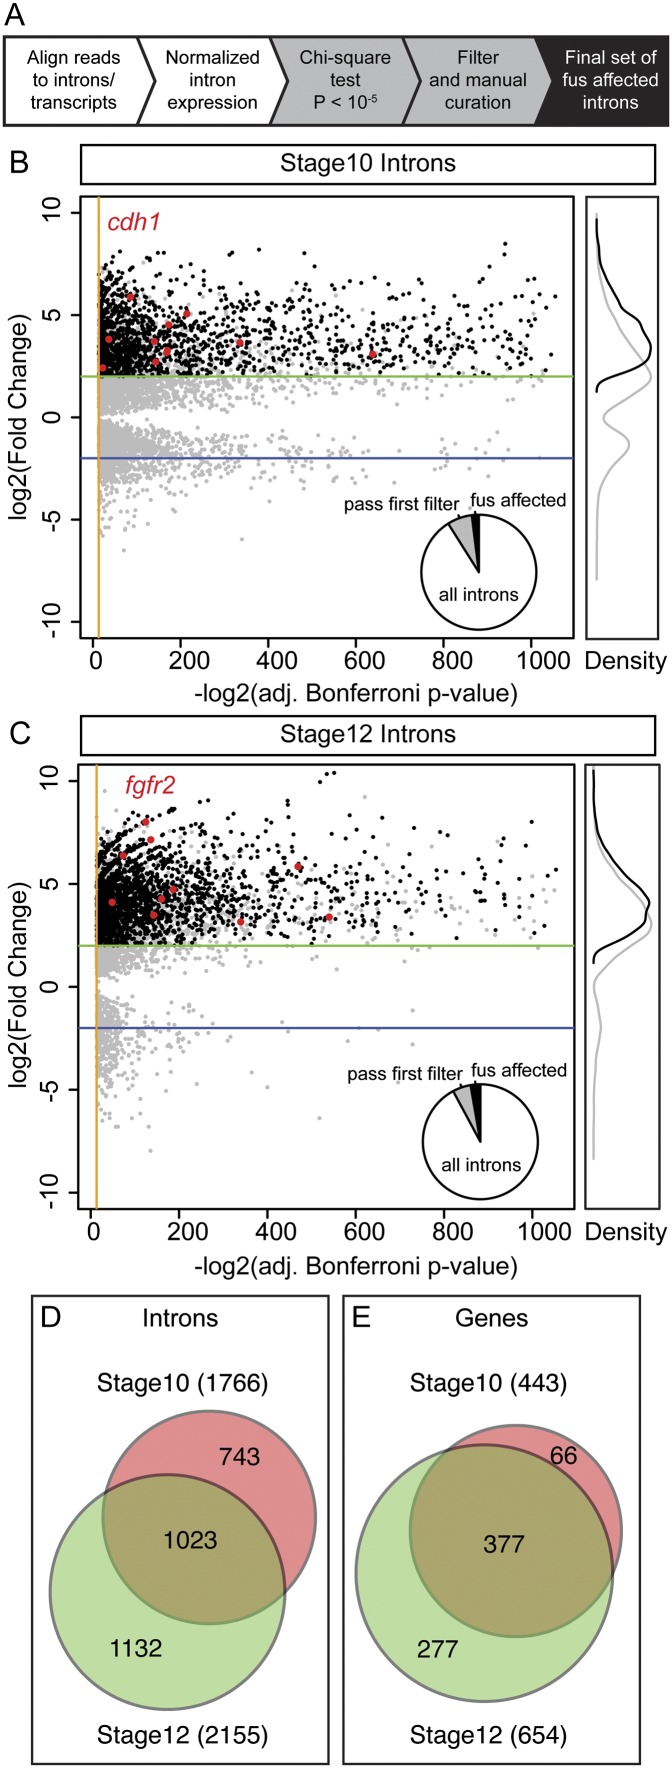
Intron retention in fus morphants affects a small fraction of all introns and transcripts. (A) Brief outline of the strategy for identifying affected introns. Scatter plot showing stage 10 (B) and stage 12 (C) introns with an adjusted P-value of <10−5. The distribution of the first pass introns (gray) indicates that the P-value is not sufficient to identify retained introns in fus morphants, as a significant number of the passed introns display only small changes. Introns changed more than fourfold and those that passed validation are shown in black. As a reference, introns from cdh1 at stage 10 (B) and from fgfr2 at stage 12 (C) are plotted as red dots. Pie charts in the bottom right of the scatter plots show the proportion of introns that pass the first filter (gray slice) and the final validated set of fus-affected introns (black slice). The white slice represents unchanged introns from expressed genes. Unchanged introns (P > 10−5) are not plotted in the scatter plots. Orange lines indicate the cutoff P-value = 10−5, and green and blue lines indicate thresholds for fourfold increase and decrease, respectively. The right panel shows relative kernel density plots of first-pass introns (gray line) and the final curated set (black line). (D) Area-proportional Venn diagrams showing the number of retained introns in fus morphants at stages 10 (red) and 12 (green), showing significant overlap between the stages. The number in parentheses indicates the total number of introns retained at the given stage. (E) Venn diagram similar to D, but showing the number of genes with retained introns in fus morphants. A significant majority (85%) of genes that are affected at stage 10 are also affected later, whereas almost half (42%) are only affected at stage 12.

