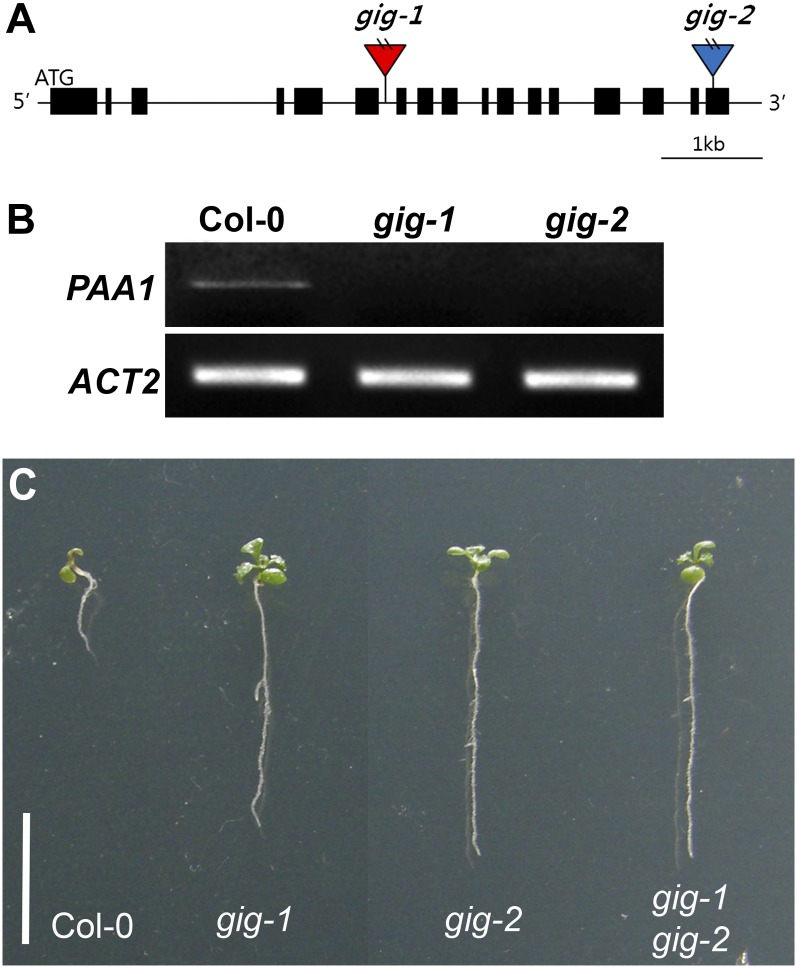
Figure 4.
Molecular identification of the GIG locus. A, Location of T-DNA insertions. The boxes depict the coding regions, whereas the lines represent the noncoding regions. The red triangle denotes the position of a T-DNA insertion in gig-1 that is isolated from an activation-tagged population, whereas the blue triangle indicates the T-DNA insertion site in gig-2 that was identified from the SALK T-DNA database. The GIG locus encodes the plastidial P1B-type ATPase Cu transporter PAA1. B, Expression of PAA1 in Col-0, gig-1, and gig-2 seedlings. No expression was detected in either gig-1 or gig-2 seedlings. C, Allelism test of gig-1 and gig-2. From left to right, Col-0, gig-1, gig-2, and F1 progeny of a cross between gig-1 and gig-2 (gig-1 gig-2). The F1 progeny show insensitivity to growth inhibition in 6% Glc. Bar= 1 cm.

