Figure 6.
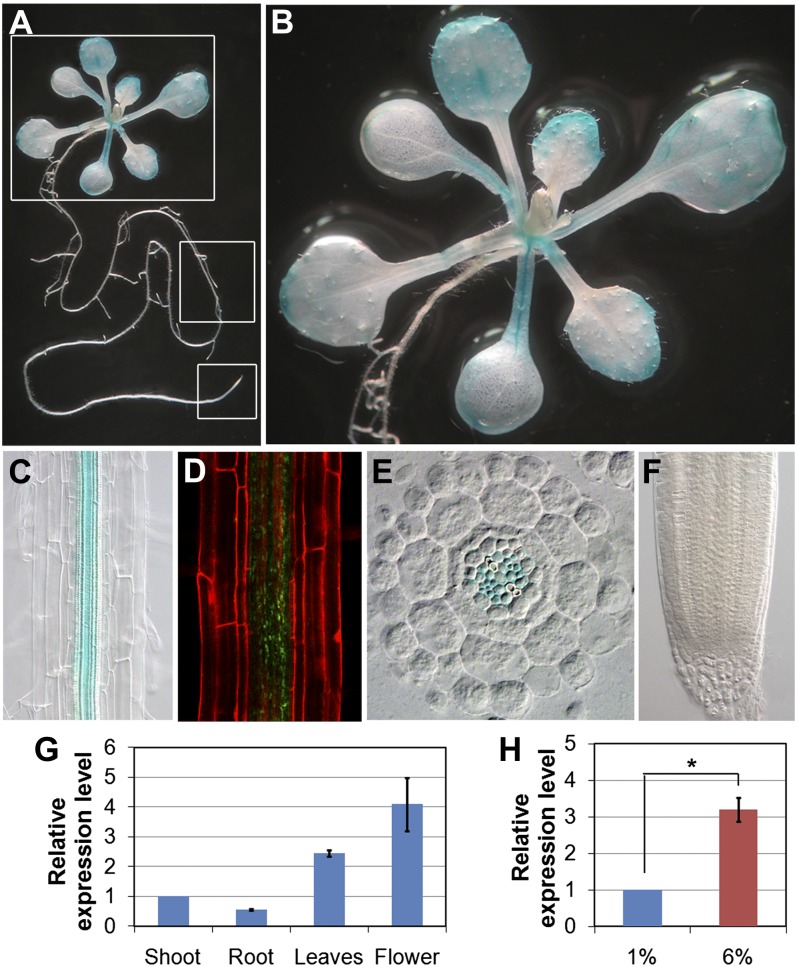
Expression pattern of GIG/PAA1. A to C, Tissue-specific expression of the transcriptional GUS fusion (pGIG::GUS) in the whole seedling (A), shoot (B), and root (C). D, Confocal image of the translational GFP fusion (pGIG::GIG-GFP) in the root. E, Transverse root section of 12-d-old seedling. Blue GUS staining is detected only in the vasculature. F, No expression is detectable in the root tip. G, GIG transcript levels in different organs as determined by qRT-PCR. The GIG mRNA level in the shoot is arbitrarily set to 1. H, Expression of GIG in the presence of 1% and 6% Glc by qRT-PCR. The statistical significance of differences was determined by Student’s t test (* P < 0.05). Error bars indicate se from three biological replicates.

