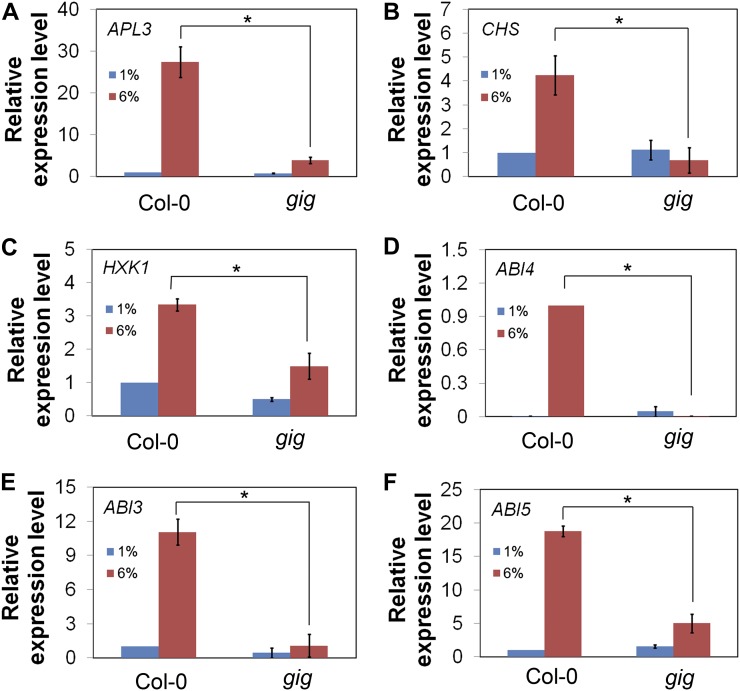
Figure 7.
Expression analysis of Glc-responsive genes. qRT-PCR in Col-0 and gig is shown in the presence of 1% (blue) and 6% (red) Glc. A, APL3. B, CHS. C, HXK1. D, ABI4. E, ABI3. F, ABI5. The statistical significance of differences was determined by Student’s t test (* P < 0.05). Error bars indicate se from biological triplicates.

