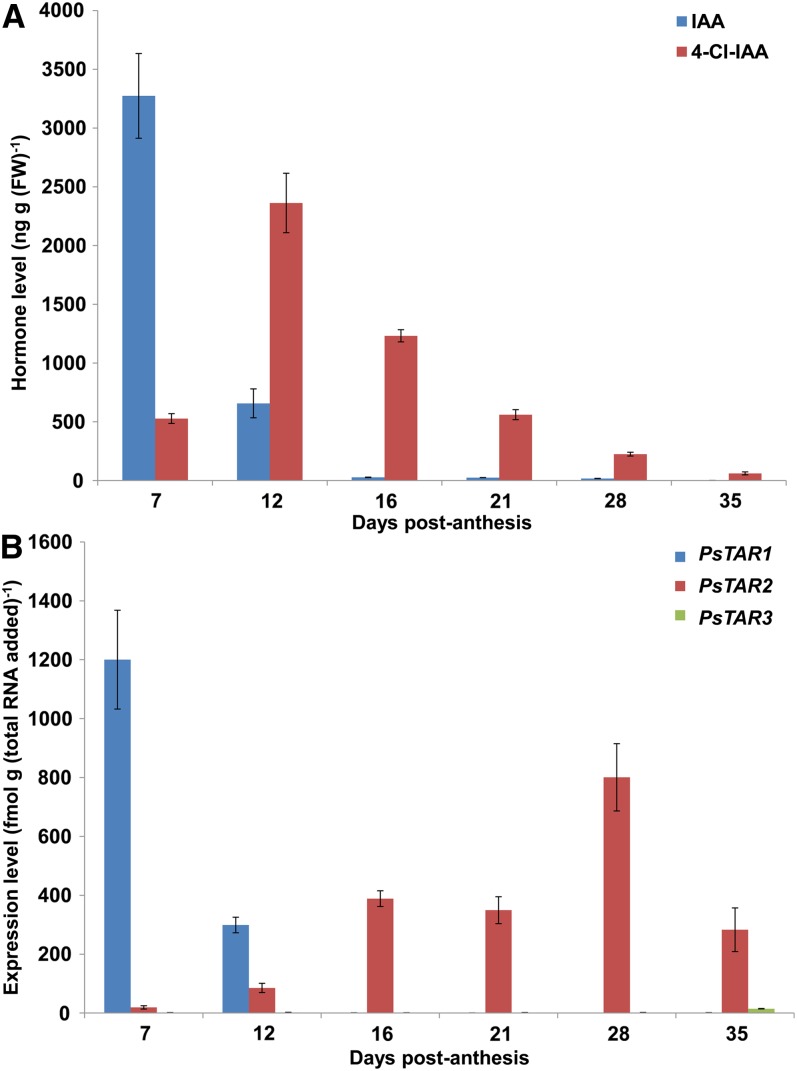
Figure 3.
IAA and 4-Cl-IAA levels (A) and PsTAR1, PsTAR2, and PsTAR3 transcript levels (B) over the course of seed development in line 107. Shown are means ± se (n = 3 for auxin and n = 4 for transcript levels). Mean seed fresh weights for each time point, in order of increasing age, were 3.8 ± 0.4, 54 ± 4, 199 ± 10, 293 ± 8, 432 ± 27, and 459 ± 12 mg. FW, Fresh weight.

