Figure 2.
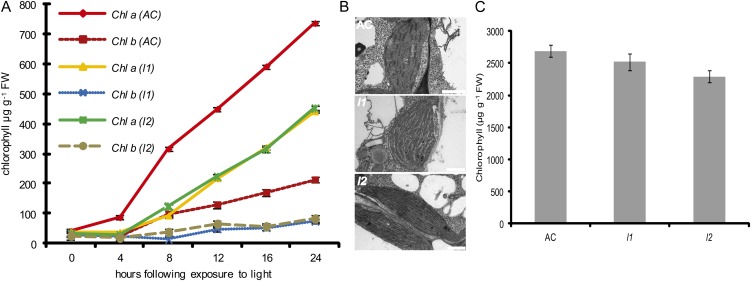
Inhibition of photomorphogenesis in lutescent mutants. A, Chlorophyll a (Chl a) and chlorophyll b (Chl b) levels in cotyledons of dark-grown seedlings following exposure to light. Data are presented as the mean of 10 replicates per data point ± se. B, Transmission electron micrographs of developing chloroplasts of cotyledons following 24 h of light exposure. Scale bars are equivalent to 1 μm. C, Chlorophyll content in expanded leaves of lutescent mutants. Data are presented as the mean of eight replicates per data point ± se.

