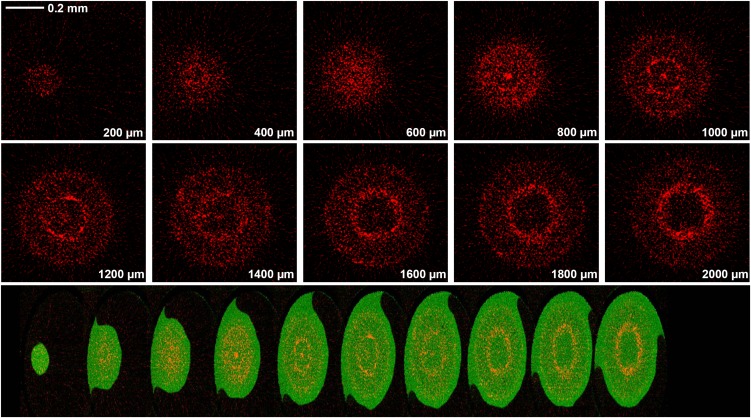
Figure 7.
Tomograms (virtual cross-sections) taken in the apex of a root exposed to 20 µm As(III) for 24 h. The tomograms were collected 200 to 2,000 µm from the apex in intervals of 200 µm, as indicated in the bottom-right of each panel. The scale bar in the first panel (0.2 mm) does not apply to the bottom panel. In the top series of images, red represents As distribution, while in the compilation of images, green represents Compton (mass) and red represents As. The bottom compilation of tomograms is a single frame captured from a reconstructed three-dimensional animation of the plant root (see Supplemental Videos S3 and S4).

