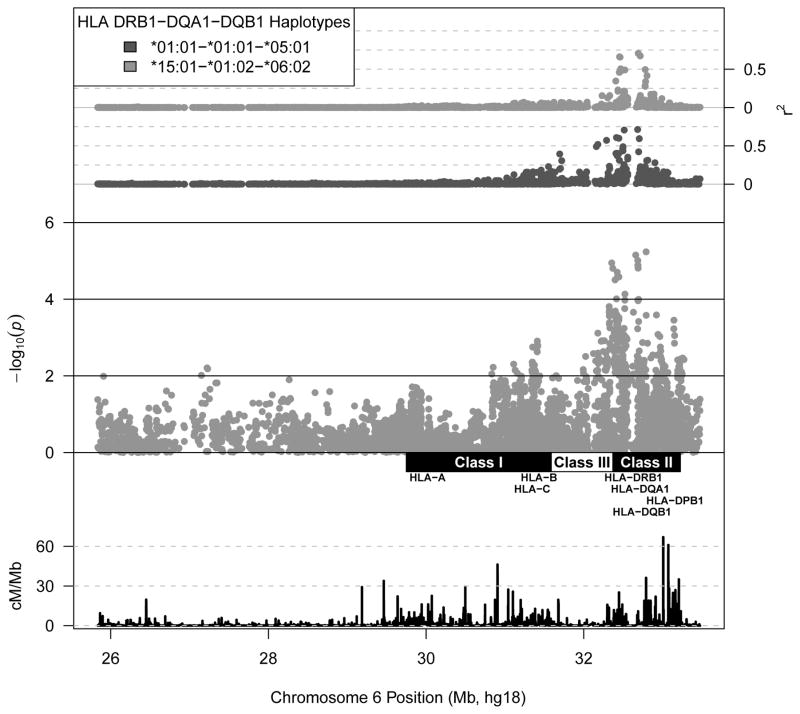
Figure 1. SNP associations with the immunoglobulin G antibody to protective antigen (AbPA) response to AVA within the extended major histocompatibility complex.
(AVA) Anthrax Vaccine Adsorbed. Middle axis displays SNP associations with longitudinal AbPA response measured at 4, 8, 26, and 30 weeks adjusted for age, sex, study site, route of administration (SQ vs IM), cumulative number of AVA doses, time since last vaccination, and the top 4 principal components (See Methods). Bottom axis displays local recombination rate estimates from the International HapMap Project [44]. Top axis displays linkage disequilibrium (r2) between each SNP and selected HLA DRB1-DQA1-DQB1 haplotypes.

