FIGURE 4.
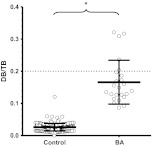
The majority of patients with BA have a DB/TB ratio of ≤0.2. Shown are the mean DB/TB ratios for controls (n = 242) versus patients with BA (n = 24). Only subjects with a TB level of >5 mg/dL were used for analysis. The dashed line indicates the recommended normal limit (0.2). a P < .0001.

