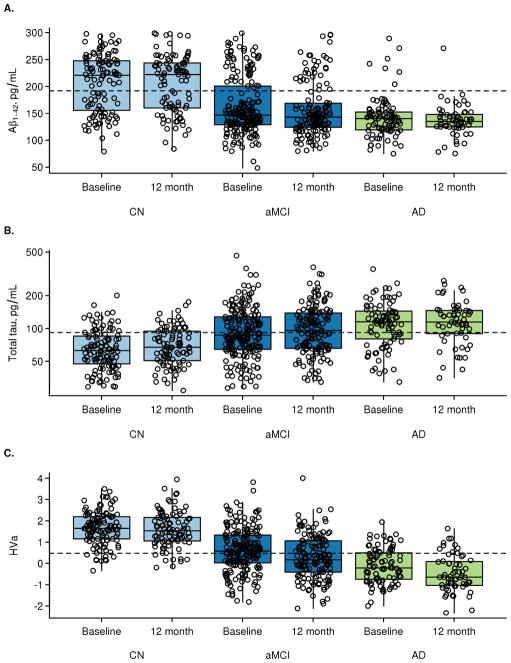
Figure 1.
Box plots and superimposed data points showing the distribution of biomarkers by baseline diagnosis and visit. Boxes indicate the quartiles and have whiskers extending to the furthest data point within 1.5 inter-quartile ranges of the box. T-tau is shown on the log scale. In subjects with both baseline and 12 month data, CSF Aβ42 is not changing from baseline to 12 months (CN, p=0.52; MCI, p=0.13; AD, p=0.51). T-tau is increasing from baseline to 12 months in CN subjects (p=0.002) but not in MCI or AD (p=0.12, p=0.36). HVa is decreasing in all clinical groups (p<0.001).

