
Figure 2.
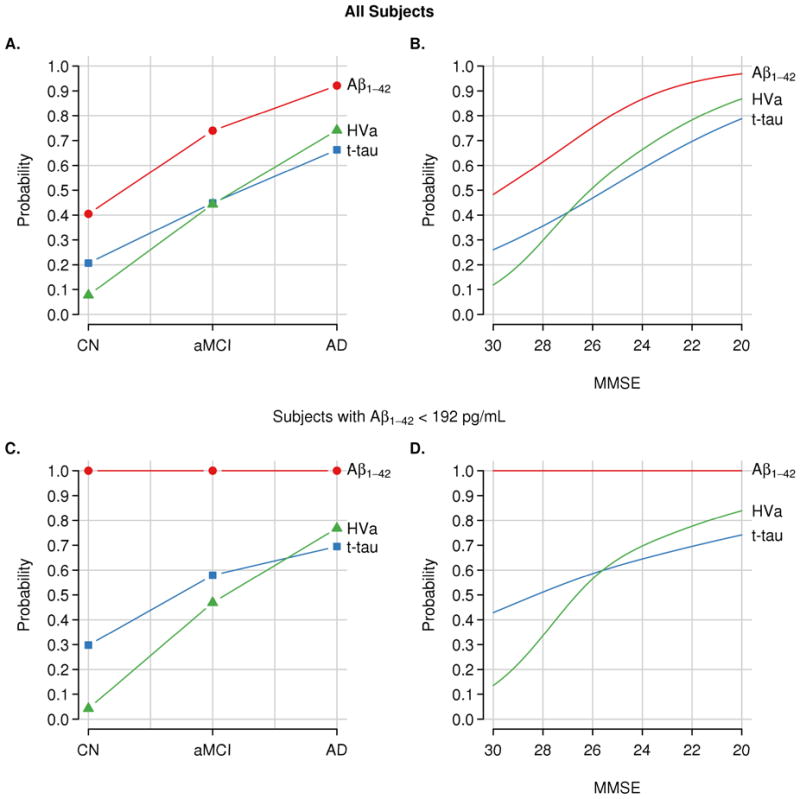
Estimated percentages of abnormality for each biomarker in all subjects (n=401) and within the subset of subjects with abnormal baseline CSF Aβ (n=274). Panels A & C show abnormality by clinical diagnosis and panels B & D show abnormality by MMSE score. Cutoffs used are 192 pg/mL for Aβ1–42, 93 for total tau, and 0.48 for HVa.