
Figure 3.
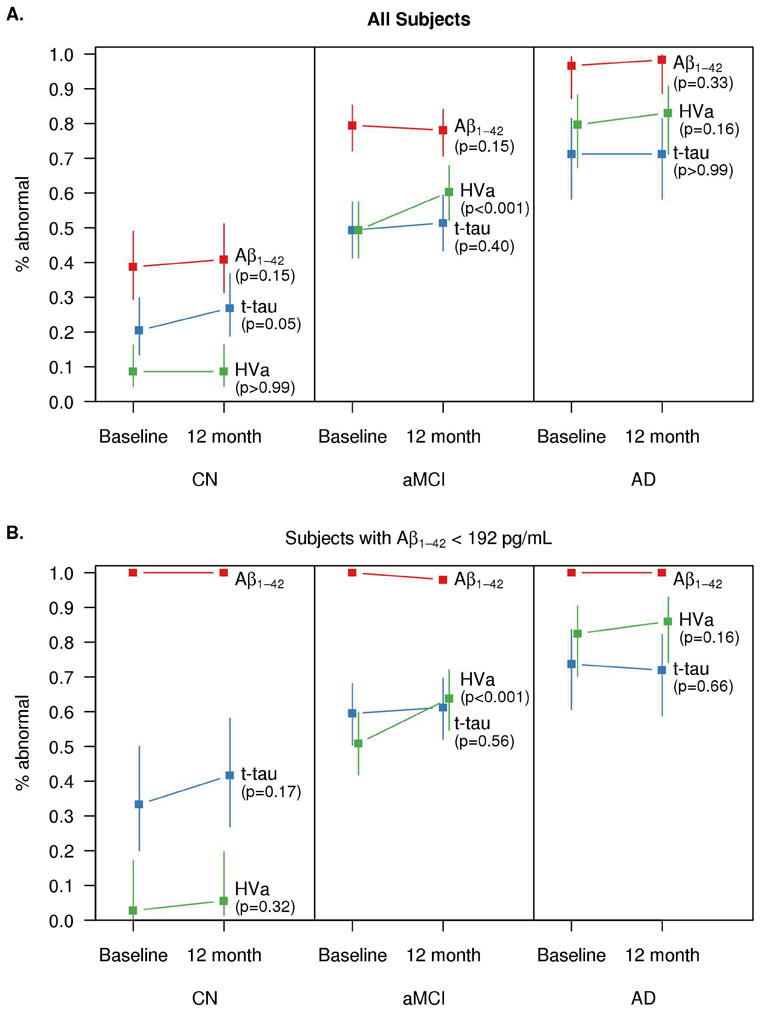
Estimated percentages of abnormality for each biomarker at baseline and 12 months by baseline clinical diagnosis for the subset of subjects with serial data (panel A, n=298) and those with serial data who were CSF Aβ positive at baseline (panel B, n=209). Values are shifted slightly along the x-axis for the middle biomarker to reduce overlap in lines. Cutoffs used are 192 pg/mL for Aβ1–42, 93 for total tau, and 0.48 for HVa.