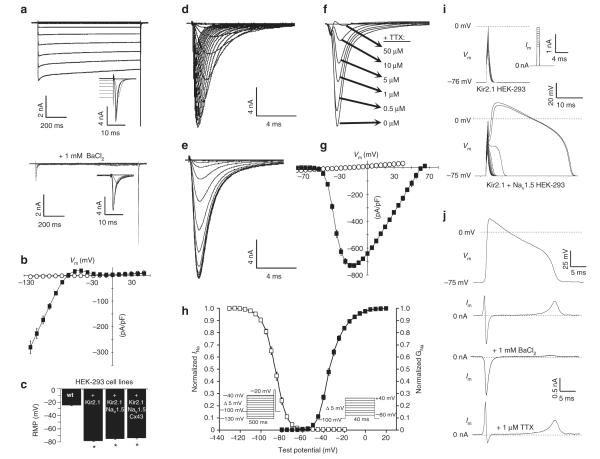
Figure 2. Stable expression of Kir2.1 and Nav1.5 yields membrane excitability in HEK-293 cells.
(a) Kir2.1 + nav1.5 HEK-293 cells exhibited BaCl2-sensitive IK1. Activation of Ina also occurred at the end of several IK1 test pulses (insets). (b) steady-state IK1–V curves obtained from Kir2.1 + nav1.5 (black squares; n = 9) and wt (white circles; n = 6) HEK-293 cells. (c) Expression of IK1 yielded significant hyperpolarization of RmP (n = 10–27). Representative recordings of Ina activation (d), inactivation (e) and TTX block (f) in Kir2.1 + nav1.5 HEK-293 cells. (g) Peak Ina–V curves obtained from Kir2.1 + nav1.5 (black squares; n = 6) and wt HEK-293 (white circles; n = 6) cells. (h) Voltage dependence of Ina steady-state activation (black squares; n = 6) and inactivation (white squares; n = 6). (i) Current pulses (inset) induced an all-or-none AP response in Kir2.1 + nav1.5 but not in Kir2.1 HEK-293 cells.
(j) AP-clamp recordings in Kir2.1 + nav1.5 HEK-293 cells revealed the individual contributions of Ina and IK1 to the AP. Error bars denote mean ± s.e.m.;
*P < 0.001; #P < 0.01; and ^P < 0.05. All recordings shown were made using the same monoclonal Kir2.1 + nav1.5 HEK-293 cell line.

