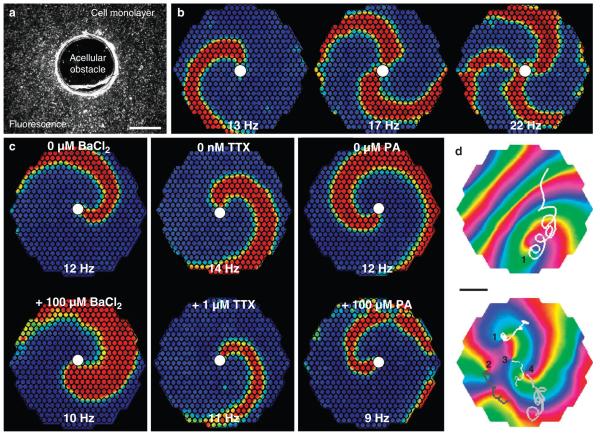
Figure 5. Spiral waves in Ex-293 monolayers.
(a) Coverslips with a 1.6-mm punched central hole were used to generate monolayers with an acellular obstacle. scale bar, 1 mm. (b) short bursts of rapid point stimulation ( > 25 Hz) from the monolayer periphery yielded formation of single or multiple spiral waves that anchored to the central obstacle (white circle) and rotated at shown rates. (c) monolayers with a single stable anchored spiral were exposed to BaCl2, TTX or PA to decrease IK1, Ina or gap junctional coupling, respectively. The application of each blocker slowed spiral rotation, with BaCl2 also causing an increase in AP duration (as evidenced by an increase in spiral wave width). Higher doses of the three compounds eventually terminated the spiral activity. Frames in b and c show colour-coded optically recorded transmembrane voltage (blue to red denote rest to peak of AP), whereas small circles within these frames denote optical recording sites. (d) In the absence of a central obstacle, rapid stimulation occasionally caused the formation of single (top panel, shown in an anisotropic monolayer) or multiple (bottom panel shown in an isotropic monolayer) freely drifting spiral waves. Drift trajectories (overlay lines) of individual spiral tips (labelled by numbers) were tracked using phase map analysis and shown over a period of ~400 ms.
The colours in the phase map denote different phases of the AP, with red colour showing the AP wave front. scale bar, 4 mm. Representative movies of spiral waves are compiled in supplementary movie 2.

