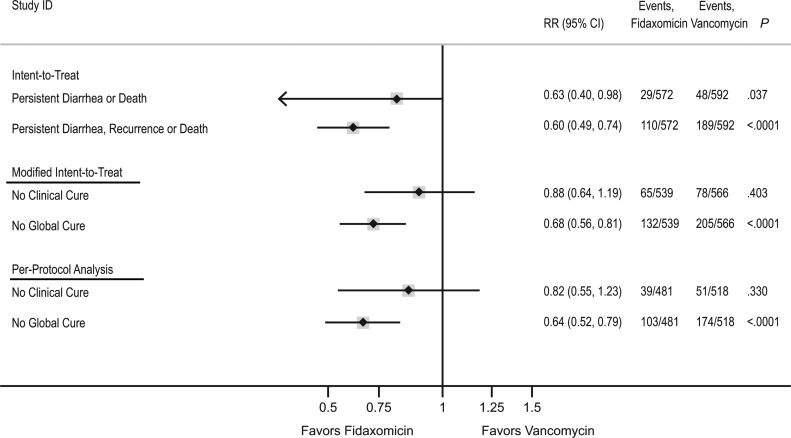
Figure 3.
Comparison of intent-to-treat (ITT), modified ITT (mITT), and per-protocol analyses of the combined 003 and 004 study populations. For the ITT analysis, persistent diarrhea or death refers to events occurring in the first 12 days of the 40-day follow-up as in the time-to-event analysis depicted for days 0–12 in the Kaplan-Meier curve. Persistent diarrhea, recurrence, or death refers to events occurring during the entire study period, days 0–40. For the mITT and per-protocol analyses, No Clinical Cure refers to the converse of Clinical Cure assessed at day 12. No Global Cure refers to the converse of Global Cure and included the 40-day follow-up. The converse of each endpoint is depicted so that relative risks for fidaxomicin versus vancomycin of <1 consistently indicate reduced risk of poor outcome with fidaxomicin. Abbreviations: CI, confidence interval; RR, relative risk.

