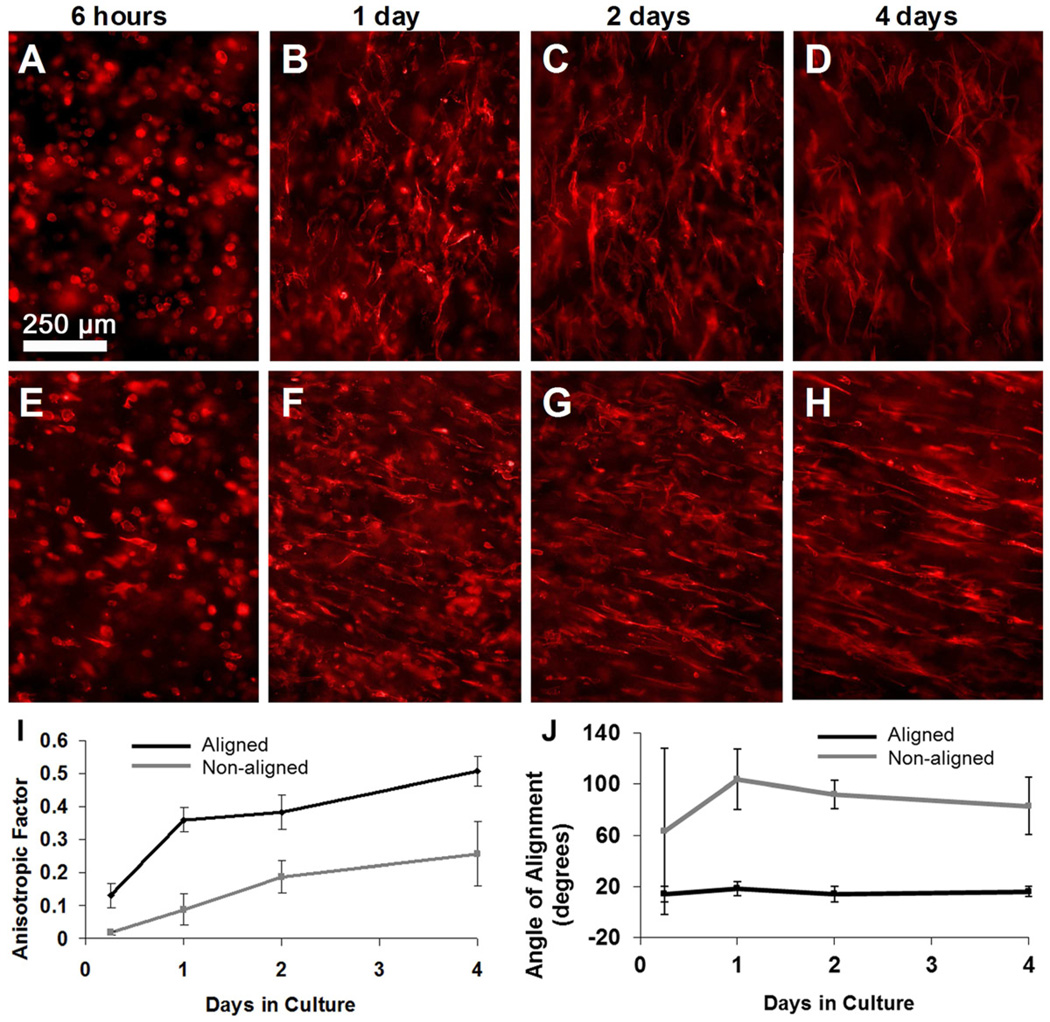
Figure 8.
Cellular alignment viewed from inner surface with the tube’s long axis in the vertical direction; Non-aligned samples (A–D), Aligned samples (E–H). FFT analysis was used to measure anisotropy from fluorescent images. (I) Anisotropic Values from Aligned and non-aligned samples remain statistically different for the entire culture period. (J) The orientation of cells was measured as the angle made between the cells’ long axis and the tube’s circumferential direction. All error bars represent standard deviation.

