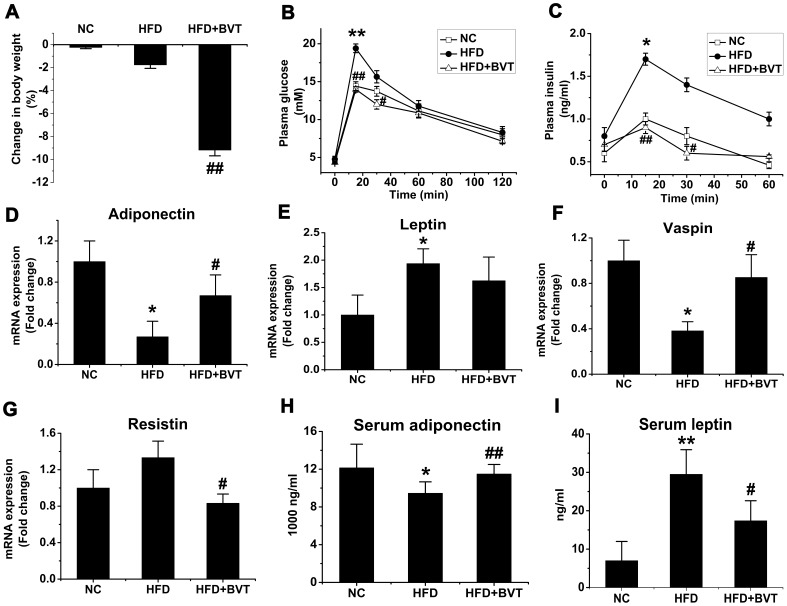
Figure 1. Effect of HDF and BVT.2733 on adiposity and metabolic parameters in C57BL/6J mice.
A, Percentage change in body weight. B–C, Glucose tolerance and plasma insulin level. D–G, Changes in adipose gene mRNA expression. H–I, Serum adiponectin and leptin concentration. The results are shown as the means ± SEM. *, P<0.05; **, P<0.01 compared with NC group; #, P<0.05; ##, P<0.01 compared with HFD group. n = 5−10 animals per group.

