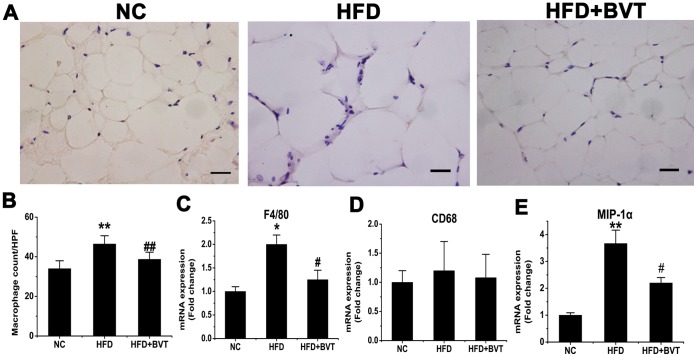
Figure 2. Effect of HFD and BVT.2733 treatment on the abundance of macrophage in adipose tissue.
A–B, Representative immunohistochemical staining of white adipose tissue using the specific macrophage marker F4/80 and quantification of the of macrophages present in adipose tissue. C–E, Changes in the expression of macrophage marker genes determined by real time PCR. The results are shown as the means ± SEM. *, P< 0.05; **, P< 0.01 compared with NC group; #, P<0.05; ##, P< 0.01 compared with HFD group. n = 6−8 animals per group. Bar = 50 µm.

