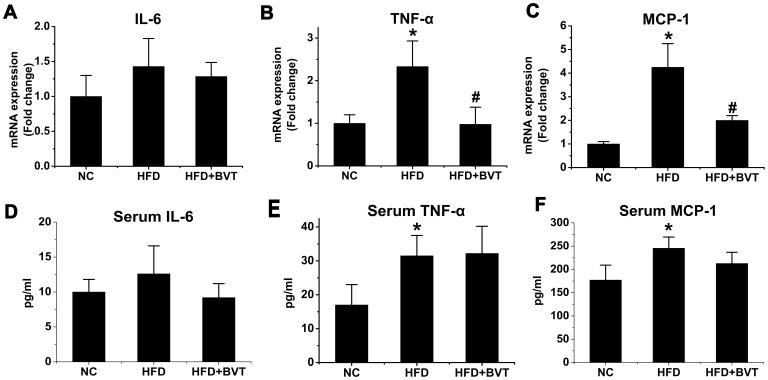
Figure 4. Effect of HFD and BVT.2733 treatment on the inflammation gene expression in the adipose tissue and the level of circulating inflammation markers.
A–C, The mRNA expression of IL-6, TNF-α and MCP-1 in adipose tissue. D–E, Plasma concentrations of IL-6, TNF-α and MCP-1. The results are shown as the means ± SEM. *, P<0.05; **, P< 0.01 compared with NC group; #, P<0.05; ##, P<0.01 compared with HFD group. n = 5−6 animals per group.

