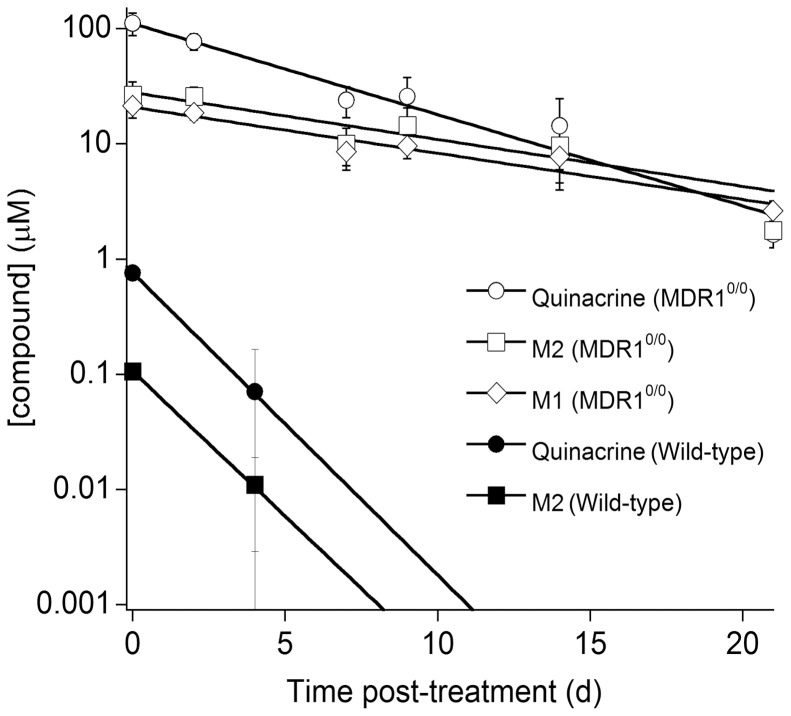
Figure 3. Clearance of quinacrine and its metabolites in wt (filled symbols) and Mdr1 0/0 (open symbols) mouse brains.
Mice were treated with 40 mg/kg/day of quinacrine in a chocolate-flavored liquid diet for 31 d and then euthanized. The quinacrine concentration in the brain was measured by LC/MS/MS. Each data point represents the mean concentration (n = 3); error bars represent SD. Y-axis shown in logarithmic scale. Circles, quinacrine; diamonds, M1; squares, M2. Metabolite M1 levels for wt mice were under the detection limit.

