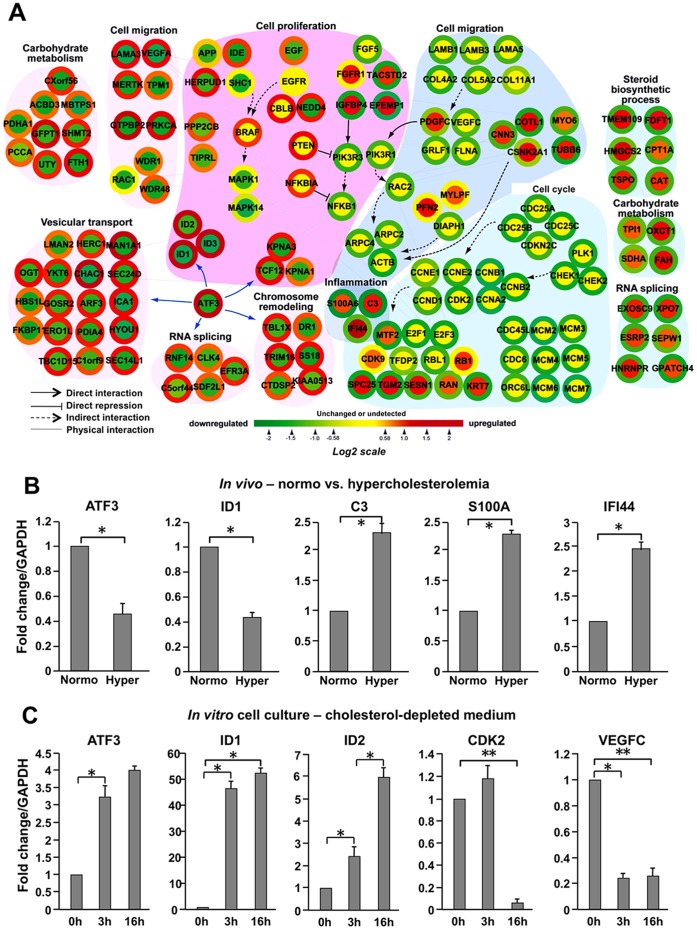
Figure 3. Network modeling of the cholesterol-responsive genes.
(A) A provisional network was generated from integration of two microarray data sets. Node color represents increases (red), no significant changes (yellow), and decreases (green) in gene expression in murine prostate tissue after cholesterol alteration as ascertained by cDNA microarray. Changes in RNA expression levels of the corresponding nodes in LNCaP cells are shown as colored node boundaries (donut shape) and the color represents increases (red), no significant change (yellow), and decreases (green) in gene expression under CDM conditions compared to control. Arrows indicate direct activation, T-shaped lines direct repression, dashed arrows indirect activation, and lines physical interaction. (B) Gene expression under Normo and Hyper conditions ( in vivo ). To verify in vivo microarray data obtained from SCID experiments, mRNA levels of the indicated genes were determined. GAPDH expression was used to normalize gene expression. Error bars represent SD (n = 3). (C) Gene expression under Control and Cholesterol-depleted conditions ( in vitro ). LNCaP cells were incubated in CDM for 0, 3 or 16 h, and mRNA levels of the indicated genes were measured by RT-PCR analysis to validate cDNA microarray data. Error bars represent SD (n = 3). *p<0.05 (Student’s t-test).

