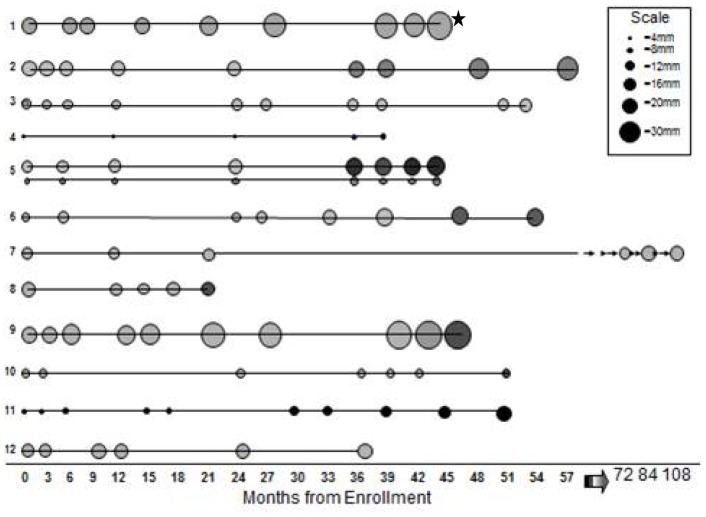
Figure 2. Clinical Course of Prevalent Lung Cancer Cases Diagnosed After More Than 6 Months of Monitoring.
Graphic representation of the course of 13 lung cancer cases in 12 patients, plotted by months from enrollment. Each circle represents a point in time relative to enrollment when a CT scan was performed. Surgical resection was performed after the last point in each case. The size of the circle is proportional to the size of the nodule on CT scan. The shading indicates the density of the nodule: grey represents ground-glass density; darker shading represents mixed density and black represents more solid density. 12/13 cases were adenocarcinomas. The asterisk indicates the only patient in this group who has expired due to lung cancer (patient 1).

