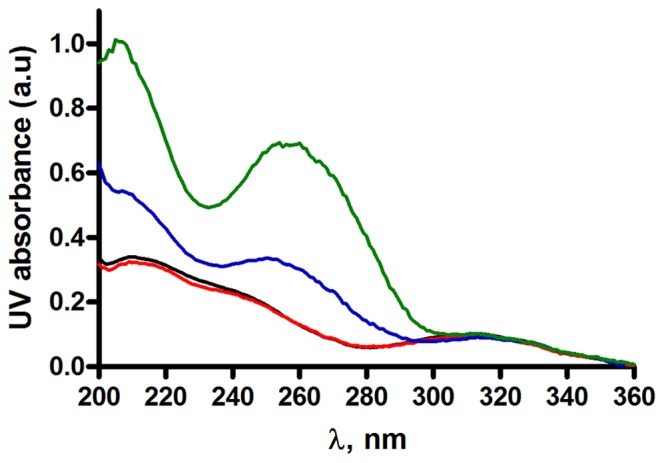
Figure 2. UV-absorption analysis of oligonucleotides.

Spectra of RAL 20 µM (black) together with 20 µM LTR32 (green), 20 µM LTR34 (blue), 20 µM LTR30 (red), in phosphate buffer pH 6, I = 0.05, and MgCl2 5 mM final concentration.

Spectra of RAL 20 µM (black) together with 20 µM LTR32 (green), 20 µM LTR34 (blue), 20 µM LTR30 (red), in phosphate buffer pH 6, I = 0.05, and MgCl2 5 mM final concentration.